MQTT and Grafana Integration
Motivation
With the introduction of MQTT logging the visualization if the statistics is fostered by usage of Grafana. The full chain from MQTT log to Grafana is provided with this extension. This extension provides a visualization of data in grafical format, which is desired for some use cases, e.g. long term analysis, several instances of the Linux TSN testbench running, and showcases. The combination MQTT/Grafana is chosen as it is the most recognized and used application for data visualization, but requires additional services for the visualization. Those services are Telegraf and InfluxDB. Telegraf performs the transfer of the MQTT data into InfluxDB insertions. InfluxDB itself is the data provider for Grafana. The configuration for those services are provided allowing the direct start with data visualization with Grafana. A docker-composer file that allows that can be generated via a bash script provided.
Enabling the build
MQTT support is integrated in the build system as an option to enable it add the flag:
cmake -DCMAKE_BUILD_TYPE=Release -DWITH_MQTT=True..
Configuration parameters
The parameters which affect the MQTT integration are presented in the table below:
Option |
Description |
|---|---|
StatsCollectionIntervalNS |
Interval in which a summary of the data is generated, typically 1s, i.e. 1000000000Ns |
LogViaMQTT |
Enable and disable MQTT logging |
LogViaMQTTThreadPriority |
Thread priority for the logging thread, usually low < 7 |
LogViaMQTTThreadPeriodNS |
Interval in which the Logging thread will read push data into MQTT, typically same value as StatsCollectionIntervalNS. |
LogViaMQTTBrokerIP |
IP address where MQTT broker is running |
LogViaMQTTBrokerPort |
Port used by the MQTT Broker, default value is |
LogViaMQTTKeepAliveSecs |
Keep alive time for the connection, default value 60s |
LogViaMQTTMeasurementName |
Used to distinguish measurements coming from different machines. |
Docker Composer
The first step is to create the docker-composer.yml file. As there is an uncertanty about the licensing on those docker-composer files and not much to be copyrighted on those, an indirect approach to deliver the file was taken. In the docker/mqtt-composer directory the file “create_docker_composer.sh” is provided. by running that file, i.e.:
cd docker/mqtt-composer
./create_docker_compose.sh
./set_permissions.sh
Creating the services
The docker-composer.sh makes the integration into Grafana simple. A simplistic way to have the Grafana running is it can be used, is to instantiate the docker-compose in the machine where reference is running, by doing that all parameters concerning the MQTT broker are default. To instantiate the docker-composer you need docker and docker-compose installed. Start the services by issuing the commands below from the tsn-testbench directory.
cd docker/mqtt-composer
docker-compose --compatibility up -d
At this point all services needed to have the data available in Grafana is done. The most important part is now how to access the data. The verification of data availability can be done in two steps: first at InfluxDB and second via Grafana.
Influx Access
Used database for the provided configuration is “testbench” and is defined in the telegraf.conf file. The measurement name is the “LogViaMQTTMeasurementName” provided in the configuration. The Timestamp provided is the time taken in the application side when the last frame in the recording period “StatsCollectionIntervalNS” is received, and the traffic class name is one of the columns of the measurment. This way one can investigate the data base by providing the following code when running influx:
use testbench
SELECT * from ${LogViaMQTTMeasurementName}
where ${LogViaMQTTMeasurementName} is a placeholder for the real name used.
Grafana Access
Grafana can be accessed by the IP of the machine that the docker-copose was started and port defined on the docker-compose.yml file. In Grafana a new data source for InfluxDB can be created and querries added to create dashboards.
Grafana Password
Grafana password has to be reset for the first usage. In some cases Grafana might also consider the password as expired refusing to allow the admin to login, e.g. extreme clock changes. To do so execute the “change_grafana_password.sh” script, with the containers running, providing the new password as parameter as below:
cd docker/mqtt-composer
./change_grafana_password.sh $NEW_PASSWORD
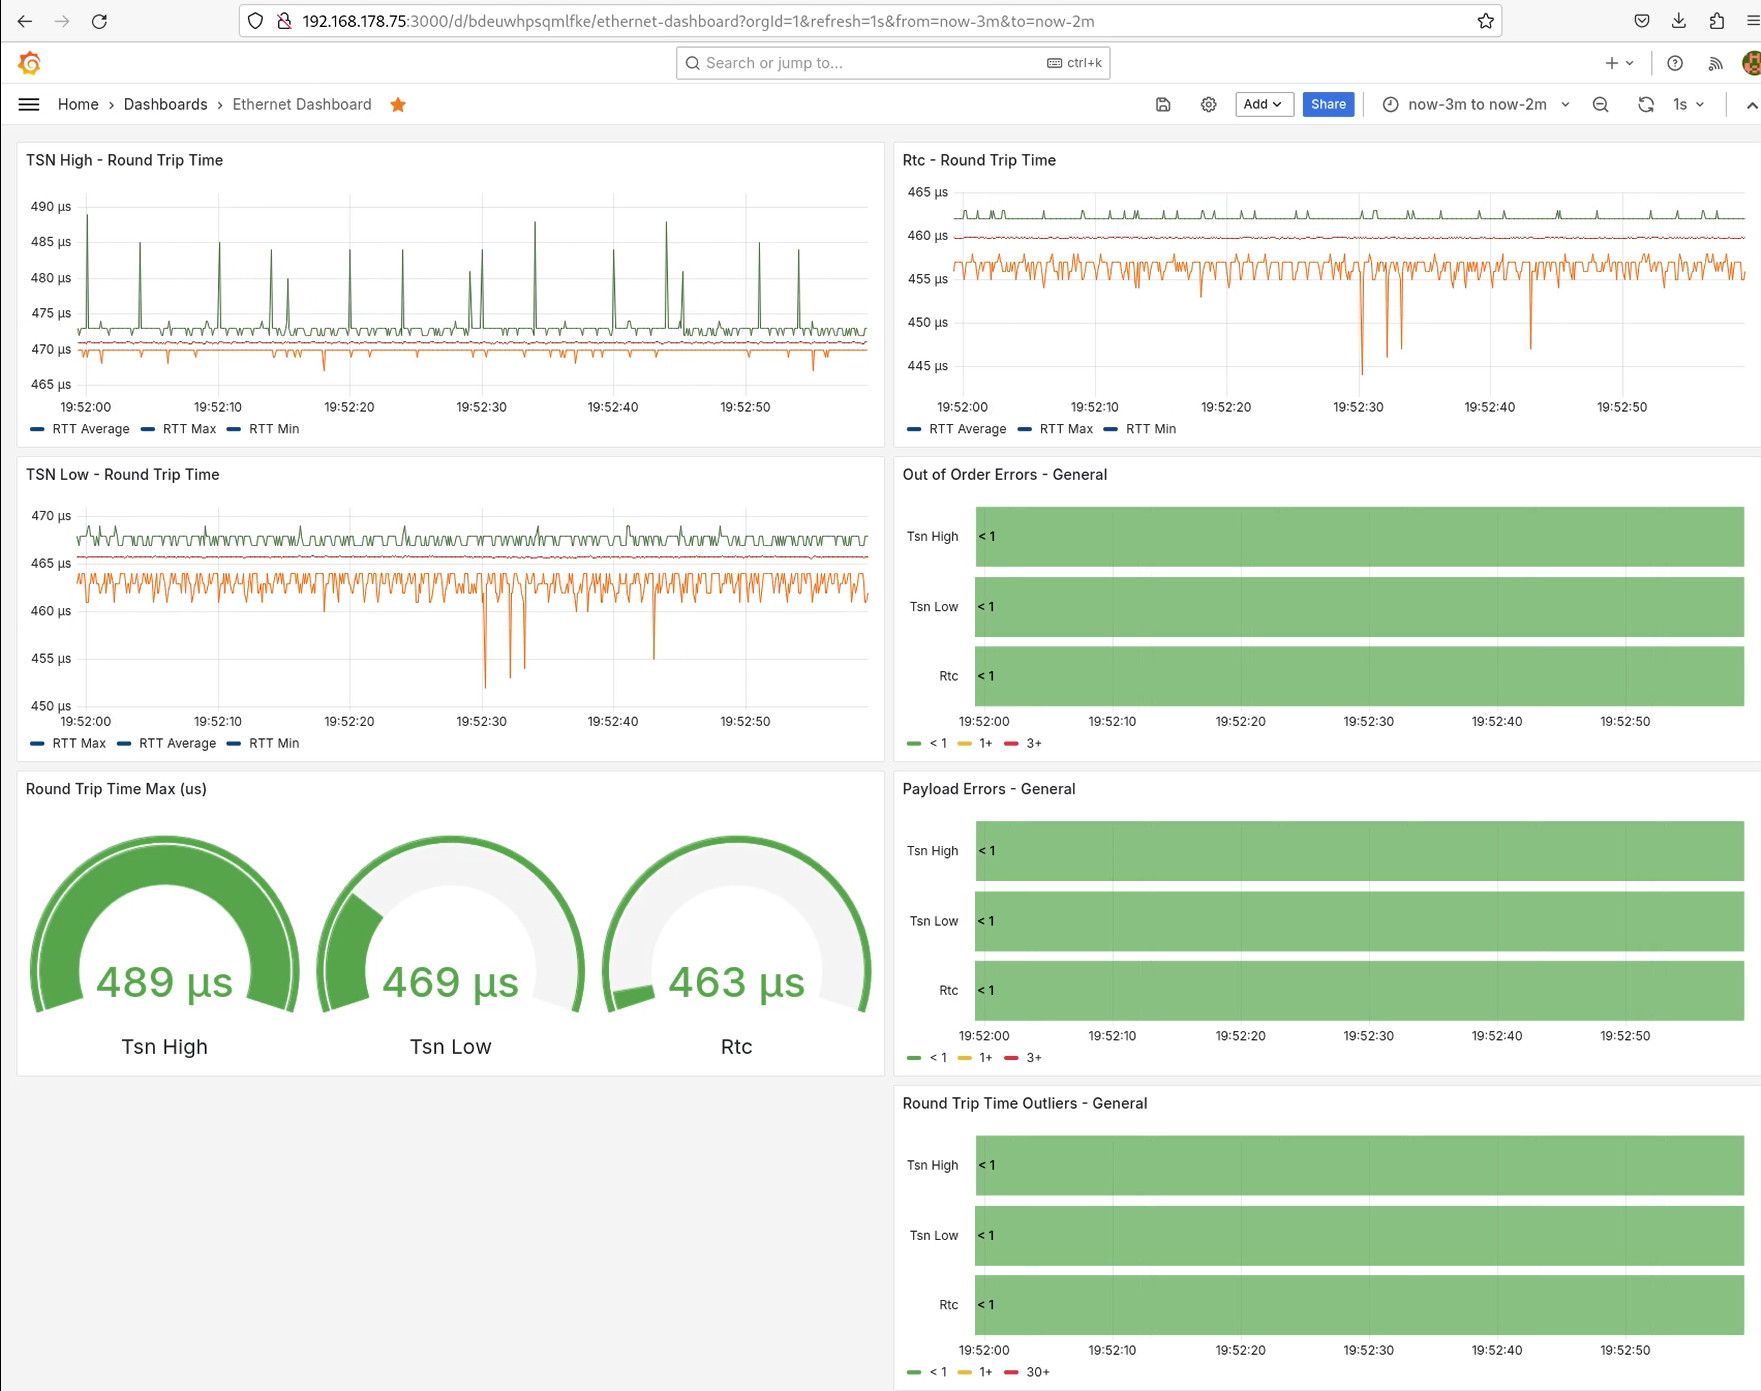
Grafana Example
The example provided for Grafana has the time display of the 3 Profinet real-time traffic classes, TSN-High, TSN-Low and RTC. Dials are provided to show the current maximum visualized within the visible time range. Colored bars are provided for representing the number of errors and outliers found.