Test runs
Execution of test runs
PROFINET follows a deadline model. Therefore, the reference application constantly measures the
round trip times of PROFINET frames. This is performed for each traffic class. The minimum, average
and maximum is calculated. The transmission and reception timestamps are taken directly in the
reference application. The collected information is regularly printed to the log file specified in
the configuration.
The worst case round trip times are predictable, as PTP is used to synchronize the involved test machines. In theory, the round trip times should not exceed two times the given PROFINET cycle. Thus, the worst case round trip time is a good indicator whether the simulation works or not. Also the outlier statistics indicate whether frames have missed the expected deadline.
In order to perform test runs two machines are required. They need to be connected either via an Ethernet (TSN) network or back to back. The link speed can be 100Mbit/s, 1Gbit/s or even higher. Before the reference and mirror application are started the network interface needs to configured. Furthermore, PTP has to be used.
For every simulation there are four steps required. Example for Intel x86 platform with i225:
PTP Synchronization
host1: cd tests/profinet
host1: ../../scripts/ptp.sh enp3s0 # Requires /etc/gPTP.cfg from linuxptp
host1: journalctl -f               # Verify that PTP is running and stable

host2: cd tests/profinet
host2: ../../scripts/ptp.sh enp3s0 # Requires /etc/gPTP.cfg from linuxptp
host2: journalctl -f               # Verify that PTP is running and stable
This step has to be done only once.
Traffic flow configurations
host1: cd tests/profinet
host1: ./flow.sh enp3s0
host1: journalctl -f               # Verify that PTP is running and stable

host2: cd tests/profinet
host2: ./flow.sh enp3s0
host2: journalctl -f               # Verify that PTP is running and stable
This step has to be done only once.
Mirror
host2: cd tests/profinet
host2: cp ../../build/xdp_kern_*.o .
host2: ../../build/mirror -c mirror.yaml
host2: tail -f /var/log/mirror_vid100.log           # Verify that mirror application runs
Reference
host1: cd tests/profinet
host1: cp ../../build/xdp_kern_*.o .
host1: ../../build/reference -c reference.yaml
host1: tail -f /var/log/reference_vid100.log              # Check statistics
The reference and mirror applications can be stopped with Ctrl-C and started again e.g. for
testing changes in the YAML configurations. However, the mirror has to be always started before
the reference. This is due to the internal sequence counting mechanism.
For use of the integrated TSN NICs on Intel Elkhart Lake a different configuration is required:
host1: cd tests/multi_middleware/stmmac/xdp
host1: ./mirror.sh

host2: cd tests/multi_middleware/stmmac/xdp
host2: ./ref.sh
Interpretation of results
The following demonstrates an example test scenario performed on Intel Comet Lake CPU(s) equipped
with Intel i225 NIC(s). All scripts and configuration are located in tests/ptm.
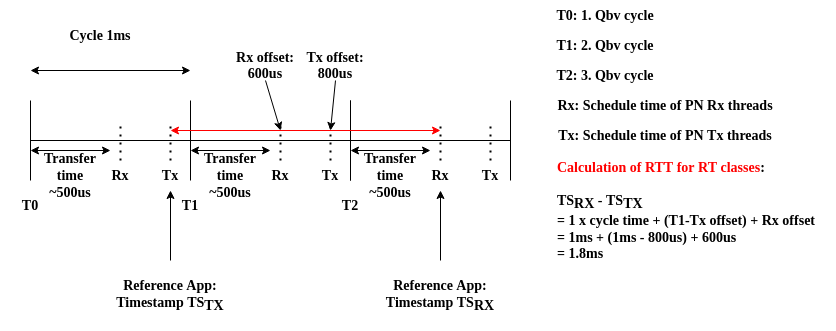
Cycle time of 1ms
Rx threads scheduled at offset 600us within 1ms period
Tx threads scheduled at offset 800us within 1ms period
64 TsnHigh frames
64 TsnLow frames
128 Rtc frames
1 frame for every other traffic class
Frame size 128 bytes for real time traffic
Frame size MTU maximum for non-real time traffic
Qbv cycle of 50 % real time and 50 % non-real time traffic
Expected behavior:
Test executed without any hardware or kernel issues
Maximum round trip times for real time traffic are below 2 x cycle time
No frames are lost
No frames are damaged
Frames are transmitted in strict priority order
At the end of the test runs the following log files have to be analyzed to determine whether the requirements are met:
Reference machine:
/var/log/reference_vid100.logMirror machine:
/var/log/mirror_vid100.log
The maximum round trip times are logged via a summary interval. Example:
TsnHighSent=973914432 | TsnHighReceived=973914304 | TsnHighRttMin=1786 [us] | TsnHighRttMax=1814 [us] | TsnHighRttAvg=1800.735701 [us]
TsnLowSent=973914432 | TsnLowReceived=973914304 | TsnLowRttMin=1773 [us] | TsnLowRttMax=1805 [us] | TsnLowRttAvg=1790.233841 [us]
RtcSent=1947828864 | RtcReceived=1947828608 | RtcRttMin=1753 [us] | RtcRttMax=1797 [us] | RtcRttAvg=1780.022262 [us]
RtaSent=76087 | RtaReceived=76087 | RtaRttMin=979 [us] | RtaRttMax=1176 [us] | RtaRttAvg=1011.953501 [us]
DcpSent=7608 | DcpReceived=7608 | DcpRttMin=980 [us] | DcpRttMax=1207 [us] | DcpRttAvg=1097.250657 [us]
LldpSent=3043 | LldpReceived=3043 | LldpRttMin=990 [us] | LldpRttMax=1196 [us] | LldpRttAvg=1165.554058 [us]
UdpHighSent=3043 | UdpHighReceived=3043 | UdpHighRttMin=1005 [us] | UdpHighRttMax=1090 [us] | UdpHighRttAvg=1035.880053 [us]
UdpLowSent=3043 | UdpLowReceived=3043 | UdpLowRttMin=984 [us] | UdpLowRttMax=1075 [us] | UdpLowRttAvg=1020.958593 [us]
As to be observed, the maximum round trip time for all real time traffic classes (TSN high/low and RTC) are below 2ms as expected. In particular, the pre-calculated round-trip time for the real time frames is 1.8ms. This test runs was executed over the period of 4 hours. In total 4 billion RT frames have been transmitted, received and checked. Not a single one missed its deadline or was damaged in any way.
The following image shows how the expected round-trip time is calculated according to the parameters shown above:
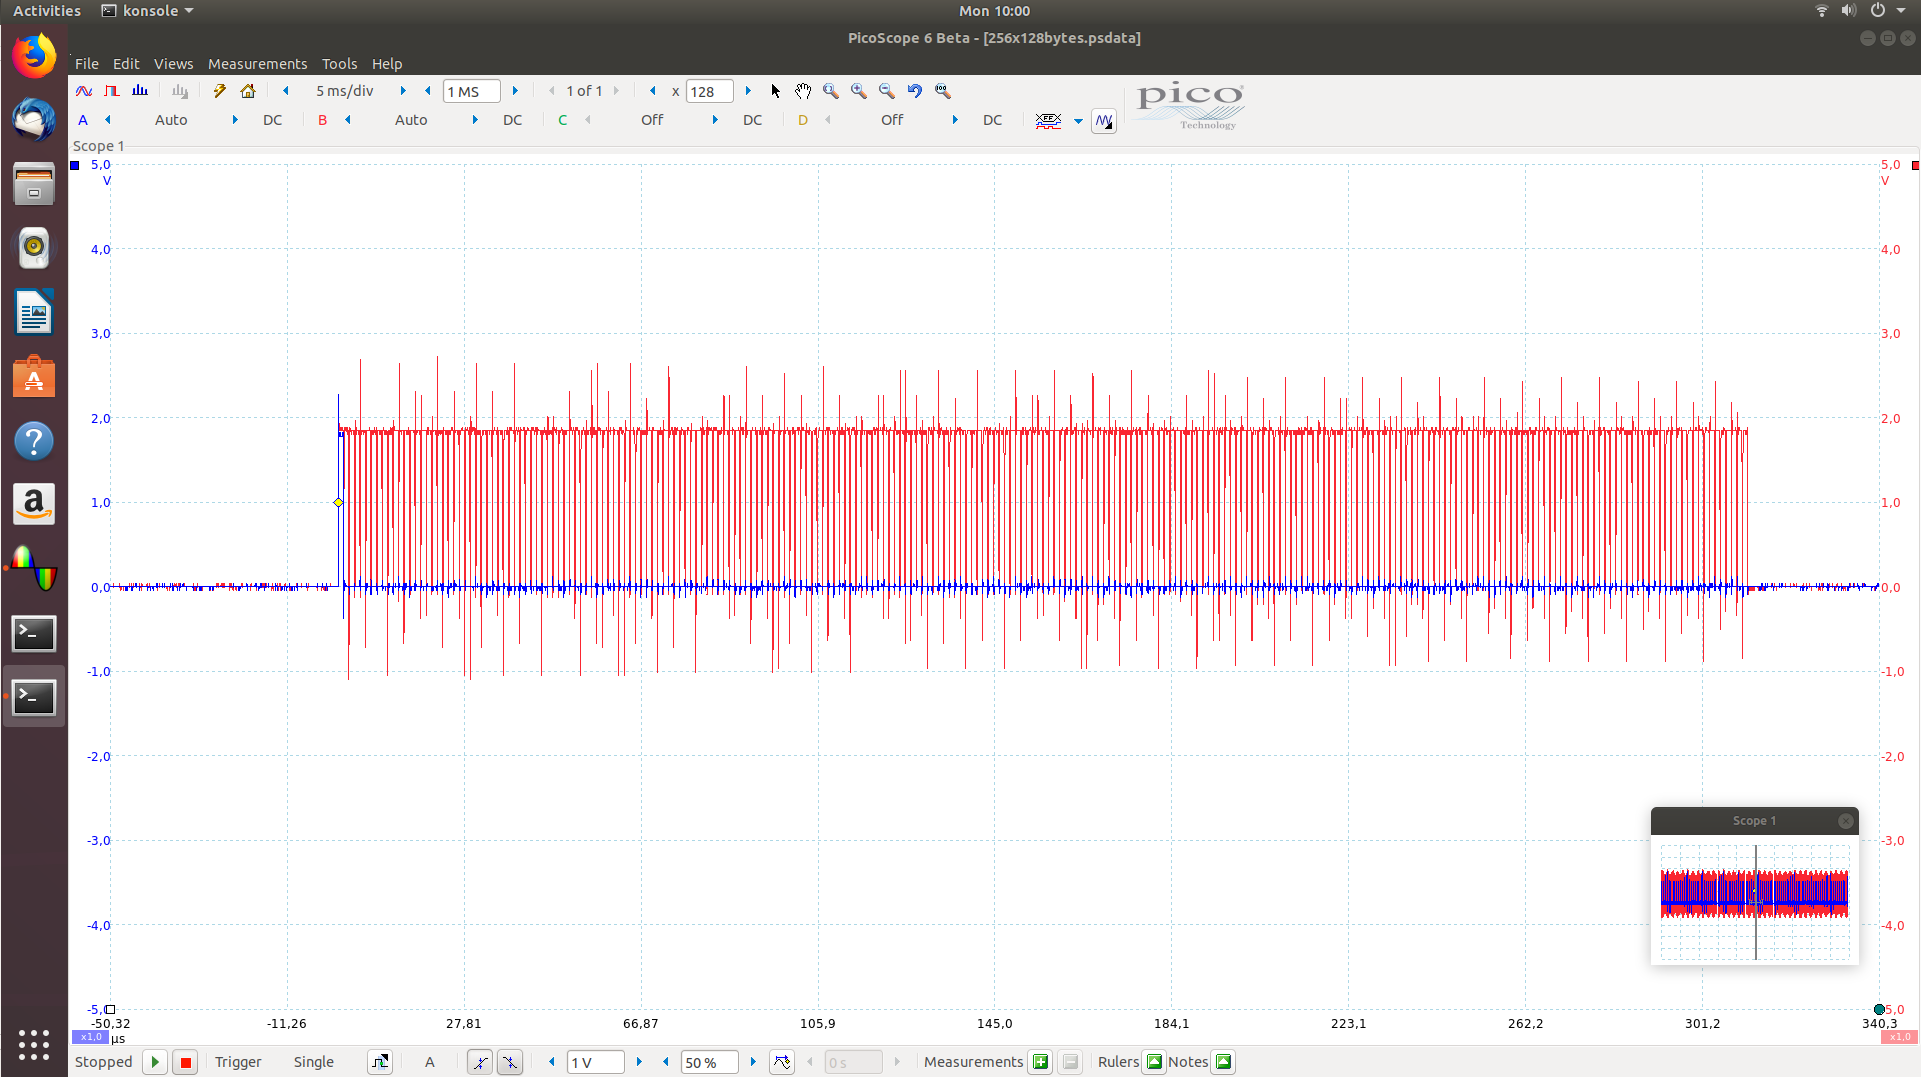
Furthermore, the Linux RealTime Communication Testbench can also be utilized to check the
Ethernet behavior on the wire. Therefore, special hardware equipment such as a TSN-Monitor from
Fraunhofer or a Profishark 1G+ network TAP is required. The image below shows a burst of real time
traffic:
Predefined Test Scenarios
Multi Middleware
The Linux RealTime Communication Testbench is able to simulate different Middlewares such as
OPC/UA PubSub or PROFINET. The multi middleware scenario is useful for analyzing whether it is
possible to execute multiple time aware applications at the same time using the same network
interface on real time Linux.
The first defined scenario is the following:
Middleware |
Traffic Class |
Frames |
VID |
PCP |
|---|---|---|---|---|
PROFINET |
TC 7 / Queue 7 |
32 x 128 |
100 |
6 |
OPC/UA PubSub |
TC 6 / Queue 6 |
32 x 128 |
200 |
5 |
OPC/UA PubSub |
TC 5 / Queue 5 |
32 x 128 |
300 |
4 |
AVTP |
TC 3 / Queue 3 |
32 x 128 |
400 |
3 |
Non-RT |
TC 4/2/1/0 |
None |
None |
None |
The second one is:
Middleware |
Traffic Class |
Frames |
VID |
PCP |
|---|---|---|---|---|
PROFINET |
TC 7 / Queue 7 |
8 x 128 |
100 |
6 |
OPC/UA PubSub |
TC 7 / Queue 7 |
8 x 128 |
200 |
6 |
OPC/UA PubSub |
TC 7 / Queue 7 |
8 x 128 |
300 |
6 |
AVTP |
TC 7 / Queue 7 |
8 x 128 |
400 |
6 |
Non-RT |
Rest |
None |
None |
None |
All required configuration files and scripts are located in tests/multi_middlware/.
Hardware: Intel Elkhart Lake with stmmac
Precision Time Measurement
Precision Time Measurement enables precise coordination of events across multiple components with
independent local time clocks. Some network cards such as the Intel i225 as well as Intel CPUs
support this feature. It can be used to increase the precision of phc2sys. Especially under
heavy system and PCIe load the usage of PTM increases the synchronization precision significantly.
The following test scenario is designed to create network and PCIe load and to test influence of PTM
for the precision of phc2sys.
Name |
Traffic Class |
Qbv Slot |
Frames |
VID |
PCP |
|---|---|---|---|---|---|
TSN High |
TC 7 / Queue 0 |
125 us |
64 x 128 |
100 |
6 |
TSN Low |
TC 6 / Queue 1 |
125 us |
64 x 128 |
100 |
5 |
RTC |
TC 5 / Queue 2 |
250 us |
128 x 128 |
100 |
4 |
Non-RT |
Rest / Queue 3 |
500 us |
None |
None |
None |
All required configuration files and scripts are located in tests/ptm/.
Hardware: Intel CPU with Intel i225/i226
PROFINET TSN
The following test scenario is designed to simulate PROFINET over TSN. It creates traffic for all eight traffic classes ranging from stream TSN to best effort.
Name |
Traffic Class |
Qbv Slot |
Frames |
VID |
PCP |
|---|---|---|---|---|---|
TSN High |
TC 7 / Queue 0 |
50 us |
1 x 128 |
100 |
6 |
TSN Low |
TC 6 / Queue 1 |
50 us |
1 x 128 |
100 |
5 |
RTC |
TC 5 / Queue 2 |
100 us |
1 x 128 |
100 |
4 |
RTA / DCP / LLDP / UDP |
Remain / Queue 3 |
800 us |
1 x 200 (1400) |
100 |
Remain |
All required configuration files and scripts are located in tests/profinet/ and
tests/profinet_zc.
In addition, PROFINET supports authentication and encryption. These mechanisms are demonstrated by
tests/profinet_auth/ and tests/profinet_crypt/.
Furthermore, most test scenarios utilize XDP for acceleration. However, there is one PROFINET
scenario which tests standard AF_PACKET sockets instead. It is located in tests/profinet_packet.
Hardware: Intel CPU with Intel i225/i226
PROFINET RT
The following test scenario is designed to simulate PROFINET RT. It creates traffic for cyclic and acyclic real time traffic as well as best effort.
Name |
Traffic Class |
Qbv Slot |
Frames |
VID |
PCP |
|---|---|---|---|---|---|
RTC |
Queue 0 |
100 us |
32 x 128 |
100 |
4 |
RTA |
Queue 1 |
100 us |
32 x 128 |
100 |
3 |
DCP / LLDP / Best Effort High |
Queue 2 |
400 us |
1 x 1400 |
100 |
7 2 1 |
Best Effort Low |
Queue 3 |
400 us |
1 x 1400 |
100 |
0 |
All required configuration files and scripts are located in tests/profinet_rt/.
Hardware: Intel CPU with Intel i225/i226
Netload
Deterministic real time Ethernet communication requires guaranteed resources in the bridges as well as the end stations for bounded latency frame delivery. Thus, resource protection mechanisms are required. Additional not planned network traffic should not lead to any disturbance of the real time traffic. Therefore, PROFINET defines ingress rate limiters for bandwidth limitations of real-time and non-real time traffic (Unicast, Multicast and Broadcast). Traditionally, this Ingress Rate Limiter is used in bridges. However, this model is interesting for end stations as well, because the CPU and memory resources of individual end stations have to be protected in cases of malfunctioning or misconfigured bridges. The following test scenario is designed to test ingress rate limiting mechanisms. In contrast to all other test scenarios the netload one ignores receive errors in case any traffic has been dropped.
Name |
Traffic Class |
Qbv Slot |
Frames |
VID |
PCP |
|---|---|---|---|---|---|
RTC |
TC 5 / Queue 0 |
500 us |
128 x 128 |
100 |
4 |
All required configuration files and scripts are located in
tests/netload/.
Hardware: Intel CPU with Intel i225/i226
Busypolling
There are applications which do prefer polling instead of interrupt driven network communication in order to reduce jitter introduced by hardware and software interrupts. The following test scenario is designed to test busy polling with AF_XDP sockets.
Note
Busy polling on PREEMPT_RT only works with Linux kernel >= v6.5.
Note
The per-queue NAPI parameters (defer-hard-irqs and gro-flush-timeout) required for
busy polling can be configured with the napictl helper. See
NAPI Configuration (napictl). The tests/busypolling_napiconf/ and
tests/er26/ scenarios use it.
Name |
Traffic Class |
Qbv Slot |
Frames |
VID |
PCP |
|---|---|---|---|---|---|
RTC |
TC 5 / Queue 0 |
500 us |
256 x 128 |
100 |
4 |
All required configuration files and scripts are located in
tests/busypolling/.
Hardware: Intel CPU with Intel i225/i226
Working Clock
IEEE 60802 (the industrial TSN profile for automation) defines at least two time domains:
Global time: Is a global time domain e.g., based on UTC. It is used to correlate events and for logging and diagnosis. Can be distributed by NTP or gPTP.
Working clock: This is a high precision time domain used for scheduling and packet transmission inside a TSN network. It is not necessarily based on UTC. It can be based on an arbitrary point in time. It is distributed by gPTP.
In this test case, the following Linux clocks are involved:
CLOCK_REALTIMEandCLOCK_TAI: Is set by NTP or gPTP.CLOCK_AUX0: Is set byphc2sysfrom network gPTP time.
Both clocks are completely independent from each other. The Testbench applications run on
CLOCK_AUX0.
Note
phc2sys requires additional patches to use CLOCK_AUX. The patches are not yet
released, but in the master branch of linuxptp.
Note
The Linux kernel does not support clock_nanosleep(2) for CLOCK_AUX yet. To run
this test case successfully we have to wait for Linux >= v7.2.
All required configuration files and scripts are located in tests/working_clock/,
tests/working_clock_2/ and tests/working_clock_3/.
Difference between these three test cases:
working_clock:
CLOCK_REALTIMEset by NTP, e.g. chrony.working_clock_2:
CLOCK_REALTIMEset by dedicated gPTP domain. Test utilizes Linux PTP vClocks for gPTP multi domain support.working_clock_3:
CLOCK_REALTIMEset by dedicated gPTP domain. Test utilizes Linux PTP vClocks for gPTP multi domain support. However, the WC is not derived from vClock, but rather uses a separate physical PHC. This allows to combine multi domain with EST.
Hardware: Intel CPU with Intel i225/i226.
Tested Hardware
The Linux RealTime Communication Testbench has been successfully tested on the following
hardware platforms and TSN NIC(s).
Hardware platforms:
Intel Elkhart Lake
Intel Comet Lake
Intel Apollo Lake
NXP imx93
TSN NIC(s):
Intel i210
Intel i225
Intel i226
stmmac
Switches
The Linux RealTime Communication Testbench relies on precise time synchronization between all
involved nodes. Therefore, the PTP is leveraged. As a consequence it is recommended to use Ethernet
switches which do support PTP based on 802.1AS.
Furthermore, when using Ethernet switches, disable the LLDP traffic class by setting
LldpNumFramesPerCycle to 0. The Linux RealTime Communication Testbench simulates LLDP
traffic with its own special crafted Ethernet frames, which are not valid LLDP messages in terms of
the 802.1AB protocol. As LLDP is link local traffic and interpreted by Ethernet switches, that will
confuse the applications and the switches. Still LLDP can be enabled in the whole network.